Key takeaways
- Complexity usually shows up in four places: metric design, contractual interpretation, product transition, and support economics.
- The same publisher can look simple in procurement but complex in audit, or simple on-prem but complex in cloud transition.
- The point is not to label one vendor as “worst.” The point is to know where to apply specialist effort first.
- Organizations that score publishers consistently make better sequencing decisions and spend less time reacting mid-cycle.
- A structured complexity view is often more useful than a long product-by-product description.
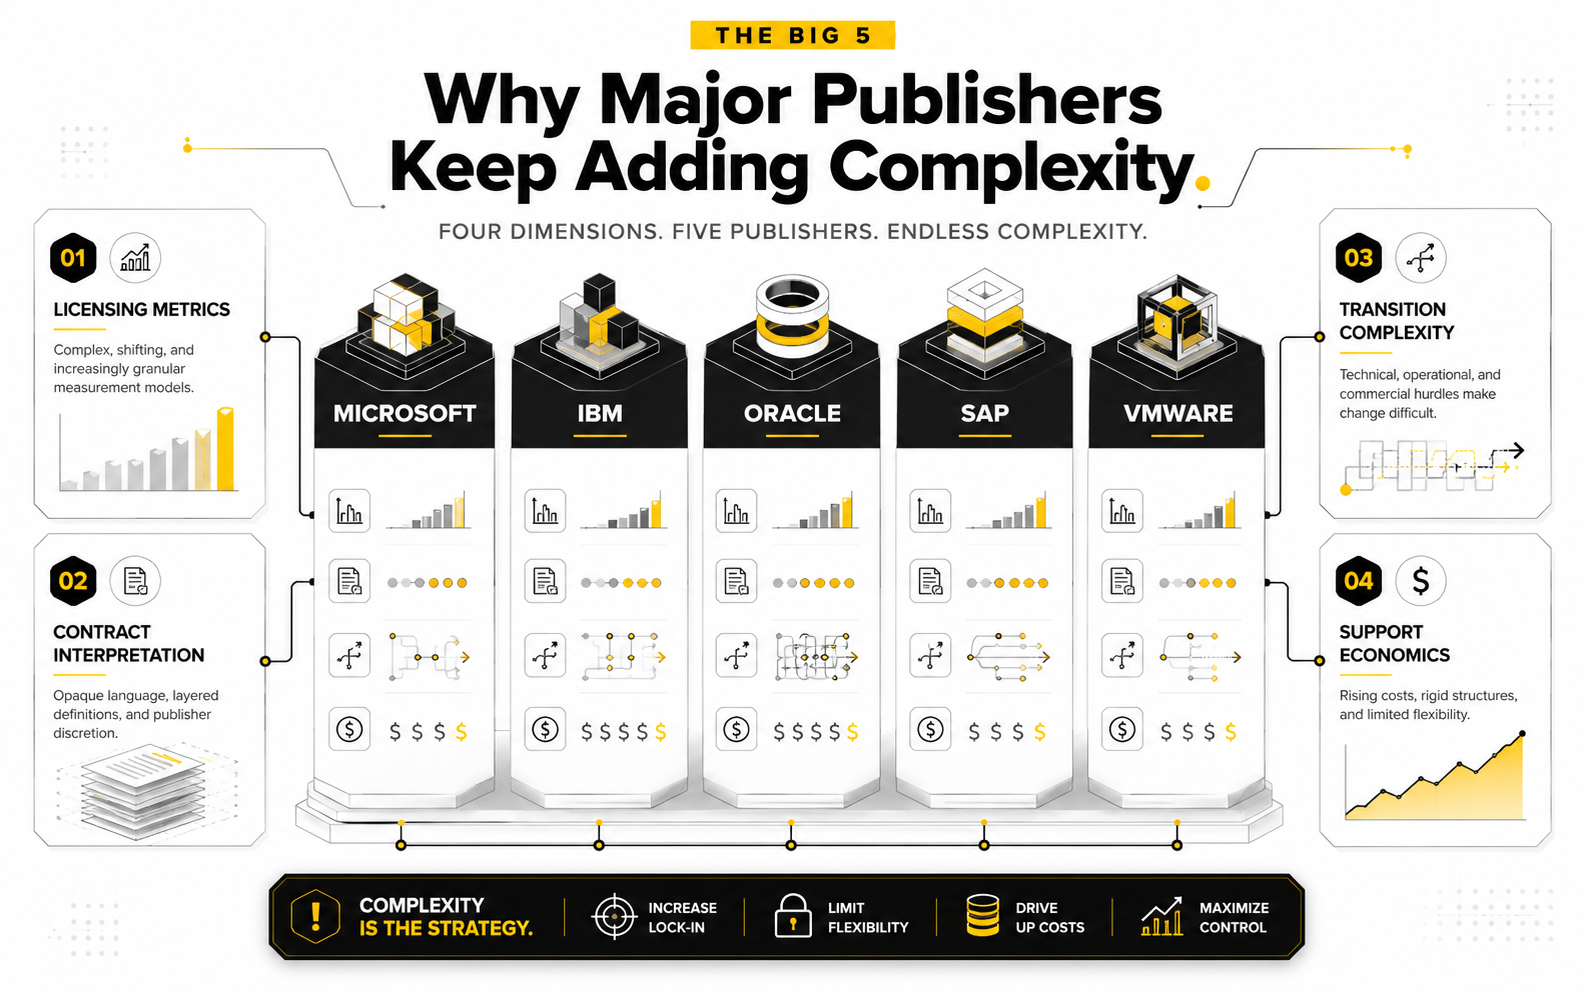
Enterprise software complexity is rarely random. It clusters around a few recurring themes. The most useful way to compare major publishers is to score them against the same dimensions rather than arguing case by case.
The 4 dimensions that matter
Metric complexity
How hard is the licensing metric to calculate, explain, and govern?
Interpretation risk
How often do teams struggle with contractual interpretation or measurement boundaries?
Transition complexity
How much friction is created by cloud, bundling, packaging, or portfolio change?
Support/commercial pressure
How strong are the renewal, support, or audit consequences of getting it wrong?
A practical scorecard
| Publisher | Metric complexity | Interpretation risk | Transition complexity | Support pressure |
|---|---|---|---|---|
| Microsoft | 4/5 | 3/5 | 5/5 | 3/5 |
| IBM | 5/5 | 4/5 | 4/5 | 4/5 |
| Oracle | 5/5 | 5/5 | 4/5 | 5/5 |
| SAP | 4/5 | 4/5 | 4/5 | 4/5 |
| VMware | 3/5 | 3/5 | 5/5 | 5/5 |
Scores are directional and intended as a decision aid, not a legal interpretation.
Why each one creates friction
- Microsoft: the challenge is not one metric. It is the interaction across Microsoft 365, Azure, server licensing, Power Platform, and evolving commercial routes.
- IBM: complex metrics, sub-capacity considerations, and tooling expectations can turn an apparently small estate into a specialist task.
- Oracle: virtualization, processor measurement, and support history can create significant interpretation and commercial sensitivity.
- SAP: named users, engines, indirect use, and digital access can all converge in the same account.
- VMware: commercial transition and platform strategy now matter just as much as technical architecture.
Where to apply effort first
- Map which publishers account for the highest combined spend and risk.
- Identify which publisher has the least reliable baseline.
- Sequence specialist review where complexity and timing overlap.
- Use the scorecard to justify governance attention, not just technical analysis.
Conclusion
Complexity is manageable when it is made visible. The organizations that do best are not the ones with no complexity; they are the ones that know where it sits and who owns it.
Quick FAQ
Who is this article for?
ITAM leaders, sourcing teams, software asset managers, procurement stakeholders, and advisors dealing with complexity-related decisions.
Detailed PDF guide
Download the full guide
The web article gives you the concise view. The PDF includes deeper analysis, visual timelines, flowcharts, checklists, and practical review steps.
What should I do next?
Use this article to sharpen your internal brief, then submit an initiative or reach out if your team needs specialist help.
Related insights

How to Reduce Support Spend Across IBM, SAP, Oracle, and VMware
A structured playbook for reducing software support cost without losing control of entitlements, roadmap flexibility, or operational resilience.

How to Defend Publisher Audits Without Escalating Risk
A structured method for responding to audits with clean entitlement evidence, usage data, contractual boundaries, and an agreed response plan.
Need help turning insight into action?
The exchange is built to help teams structure the problem first—then engage the right expertise.